
During the course of our studies, we observed inconsistencies in the results of several experiments, particularly among undergraduate members of the lab.
A frequent source of variation is the cell counting and seeding technique, which takes some time to get used to. Therefore, we hypothesised that cell density could be the factor that generates variation among the cellular signalling pathways that we studied.
Using surplus cells from ongoing experiments, we prepared a cell density experiment. Cells were plated in 10% increments from 80 thousand to 800 thousand cells per 6 cm dish. This was to simulate different seeding densities.
The initial cell densities were too sparse for immediate analysis, so the cultures were monitored over several days as they continued to grow. The six densest dishes were allowed to grow to confluence, forming increasingly compact monolayers. The remaining four dishes represented cells approaching confluence. We aimed to assess cellular signalling across a range of cell densities, from cultures that were nearing confluence with visible gaps between cells to those that had formed and maintained densely overgrown monolayers.
By the fifth day, the cultures had reached confluence. As the SESN1&2 knockout (SESN1&2-/-) cells grow slightly faster than the wild-type control (CTRL) line, they formed a visibly tighter monolayer, and their culture medium appeared more orange. SESN1&2-/- cells were lysed at this point, while CTRL cells were lysed 8 hours later, once they reached a comparable monolayer density. The lysis time for CTRL was determined by the medium colour, matching the orange hue observed in SESN1&2-/- dishes at the time of their lysis.
Animated Figure
A Daily monitoring of cell growth at different seeding densities. Cells were plated at the indicated initial densities (×10³) on Day 0 and imaged daily to monitor growth. Dishes seeded at higher initial densities (400-800×10³ cells) were allowed to grow to a monolayer for later comparison to lower, sub-confluent densities. Medium colour was recorded as an indirect indicator of culture state, and cells were subsequently harvested for Western blot analysis.
The cell dishes were photographed each morning (Days 1-5) and again immediately before lysis (Day 5 + 8 hours) using an Olympus IX81 microscope with a camera attachment. The colours of the dish medium were photographed and recorded using a phone camera. Cells were subsequently lysed for Western blot analysis.

Animated Figure
B Full time-lapse of the entire cell panel. Images of all individual culture dishes were captured daily, in the morning, using an Olympus IX81 light microscope. Each panel corresponds to one dish, with two technical replicates (Rep 1 and Rep 2) per cell line. This figure complements Figure A by showing the complete set of replicates.
The results of this experiment are not published and may be utilised in the future. For the purpose of result preservation, the names of the proteins have been withheld.
The Western blot analysis showed us that many proteins that we work with are severely affected when cells are in a monolayer. The pathways behaved in a manner consistent with published findings only when cells were still growing in a dispersed stage (20% samples). In addition, some pathways that typically showed clear differences between wild-type and knockout cells no longer showed these differences.
This experiment illustrated the dependence of our Western blot experiments on consistent cell plating and solved many anomalous results that we received from students in the lab, who typically have less experience in consistently plating cells. Following this experiment, we are now asking all students to monitor cell density prior to conducting experiments, which has improved the reproducibility of their results.

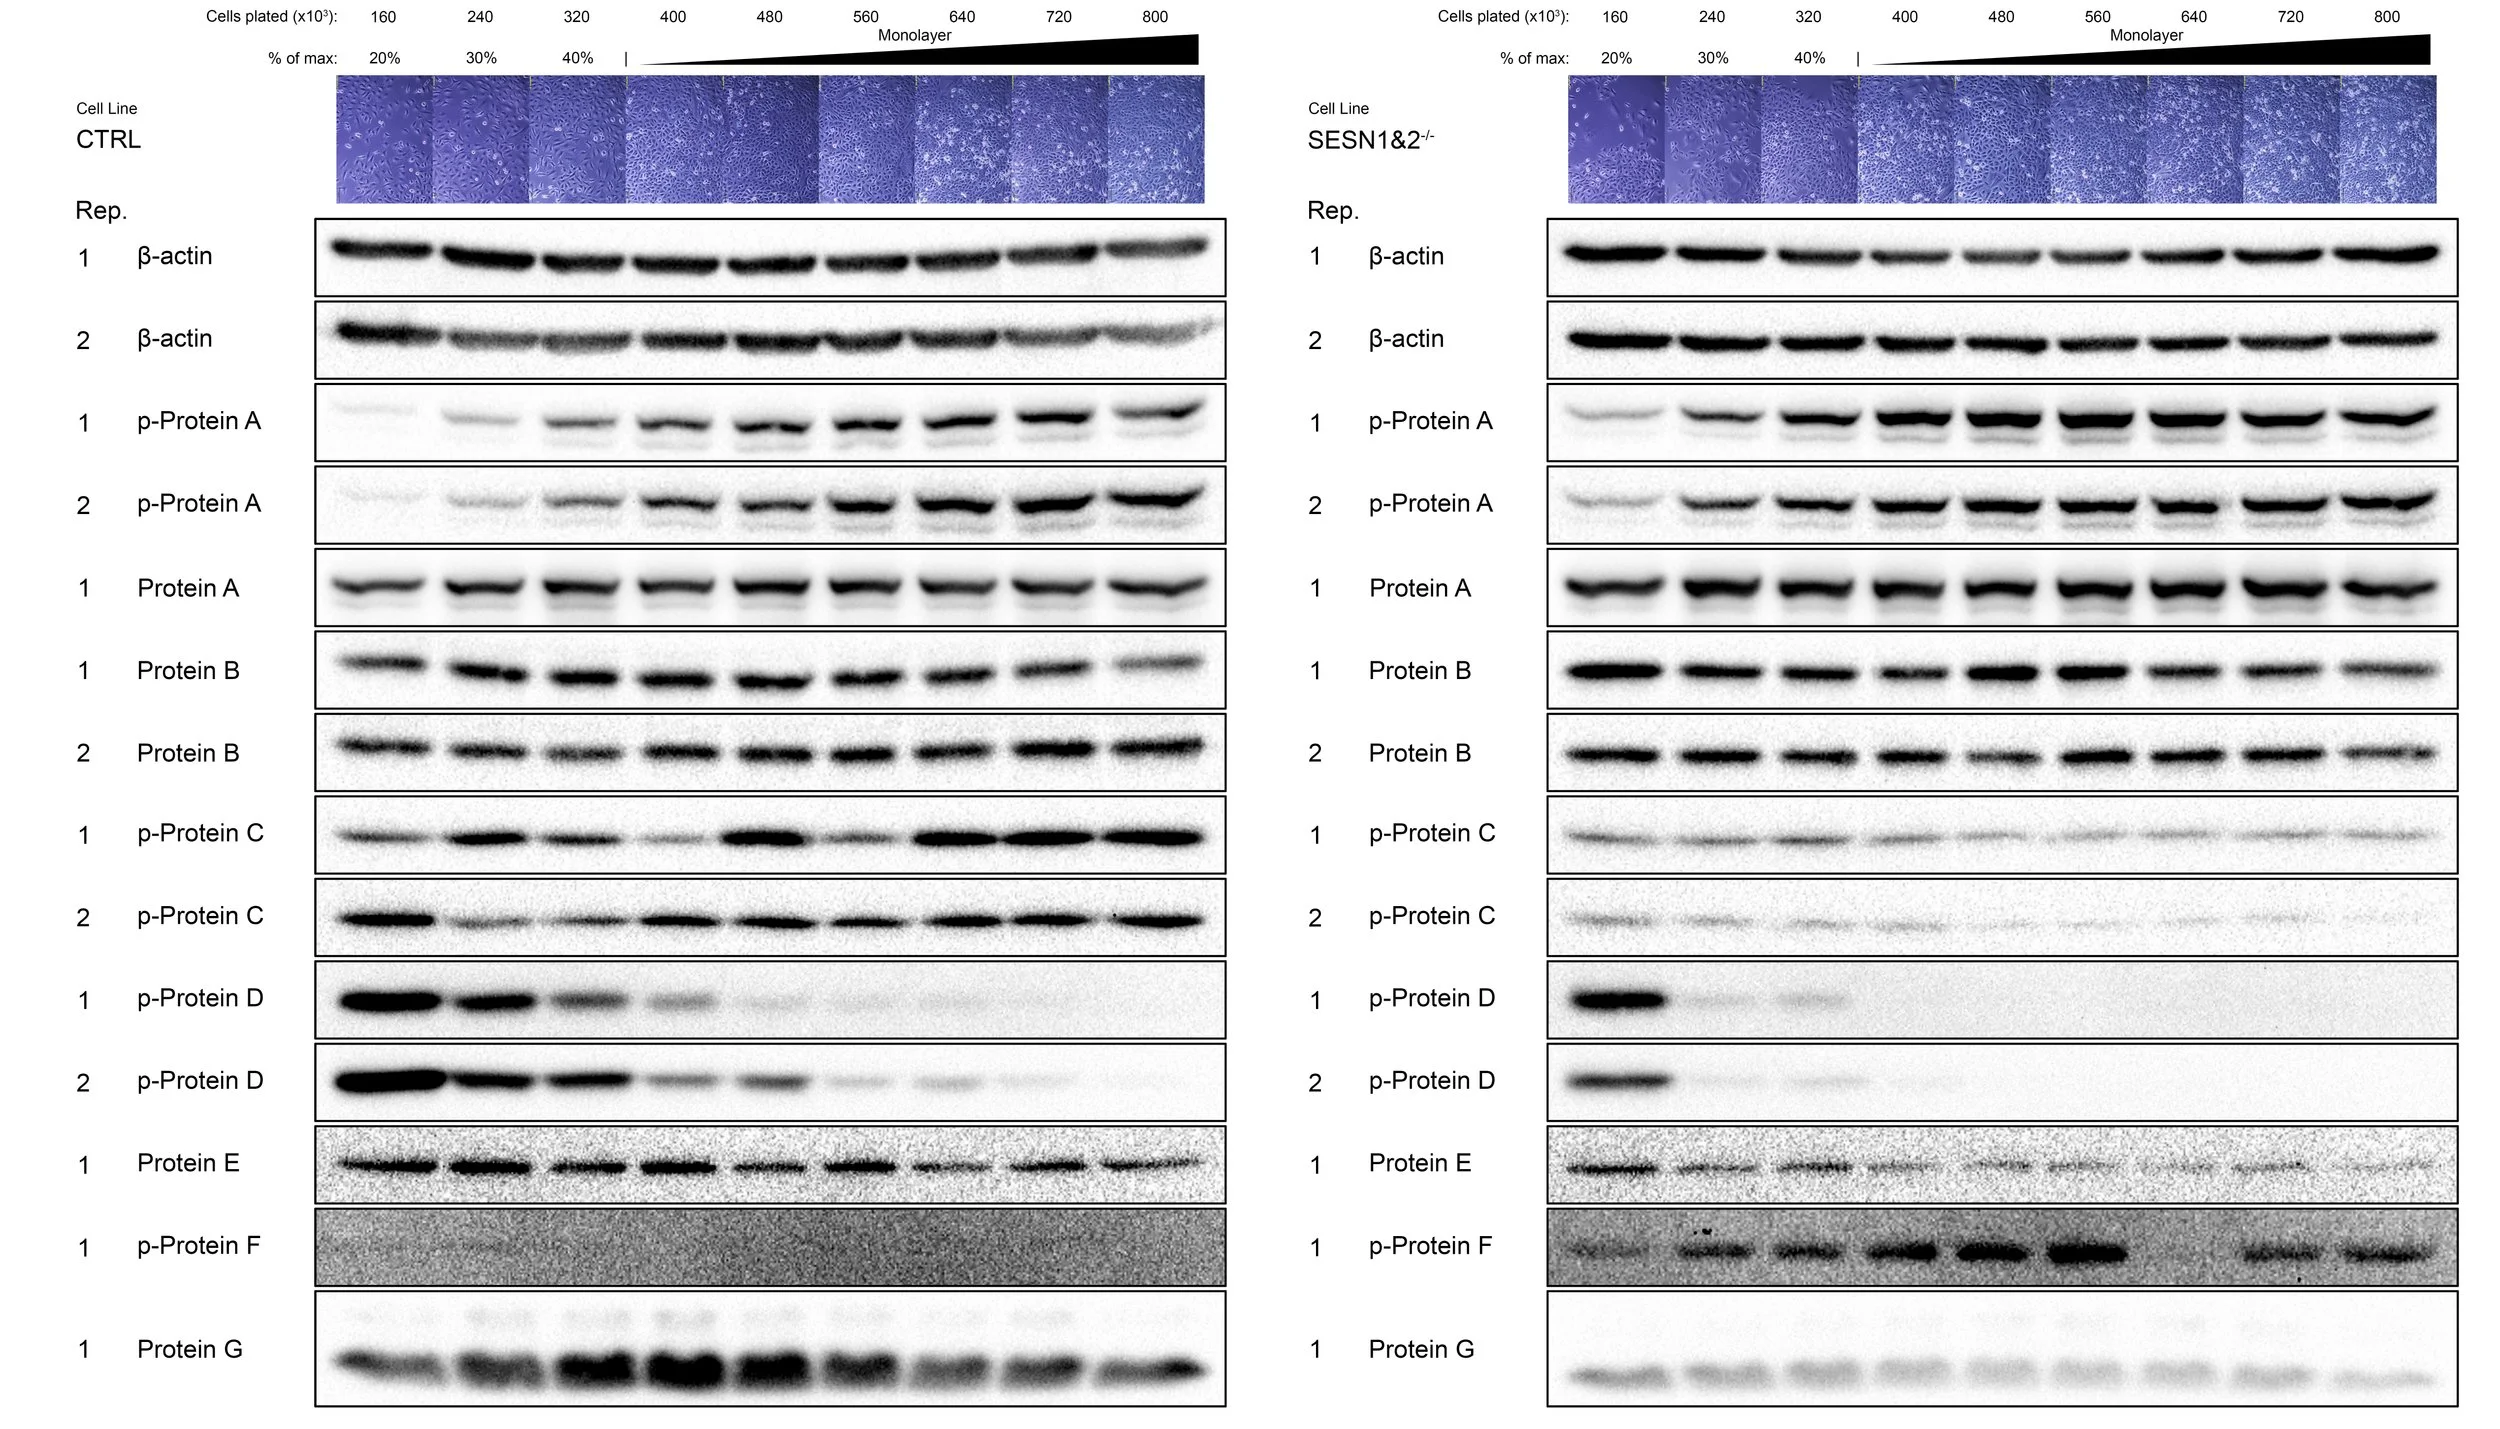
Figure - Western Blot analysis of the cell density experiment
C Each dish was lysed and prepared for Western Blot. The 10% sample did not have enough protein for a 20 μg/well loading, and hence was left out. Each strip of Western blot may come from separate gels, so comparisons must be limited within the same photo strip (i.e. between 20% to 100% sample). The photograph of the representative dish is presented above each corresponding band. Replicates (Rep.), if available, are numbered. Replicates 1 and 2 represent separate 6 cm dish samples.
Limitations of the experiment
The primary issue of the experiment was that the cells were allowed to grow for five days prior to analysis. This introduces a large component of time for which there could be no adequate control. Furthermore, the cells may have grown in ‘islands’ for an extensive period of time, reinforcing cell-cell contacts and emphasising the ‘island’ growth phenotype. Our SESN1&2-/- cells grow faster, and there is a strong possibility that there was a significantly higher cell number in SESN1&2-/- dishes.
A solution to this issue would be to plate a larger number of cells and lyse them directly on the following day. However, a greater number of cells would be required for such an experiment (we used ~8.8 million cells per cell line, but an approximate amount of 41.5 million cells per cell line would be required to plate the same number of cells that we observed on Day 4).
