The following data were generated by an undergraduate student I supervised over an 11-week research project. During this time, the student became proficient in key laboratory techniques, including cell culture and western blotting. The goal of my supervision was to provide the student with an opportunity to engage directly with the scientific process and to support them in generating a meaningful experimental result.
The projected aimed to examine how a specific form of cellular stress, induced by a compound well-known to cause this type of stress, affects SESN2 gene activation and mTORC1 signalling.
For reasons of privacy and in case my PI chooses to publish or make further use of the results, the student’s name and the name of the compound have been withheld.
Shortly after learning to perform Western blotting, the student conducted a concentration titration pilot experiment to assess the ability of the compound to induce SESN2 expression.
The results show that SESN2 protein levels are markedly upregulated at a concentration of 500 ng/mL (Figure 1B-C). A modest reduction in mTORC1 activity, assessed by levels of phospho-S6 and phospho-4E-BP1, was also observed (Figure 1B).
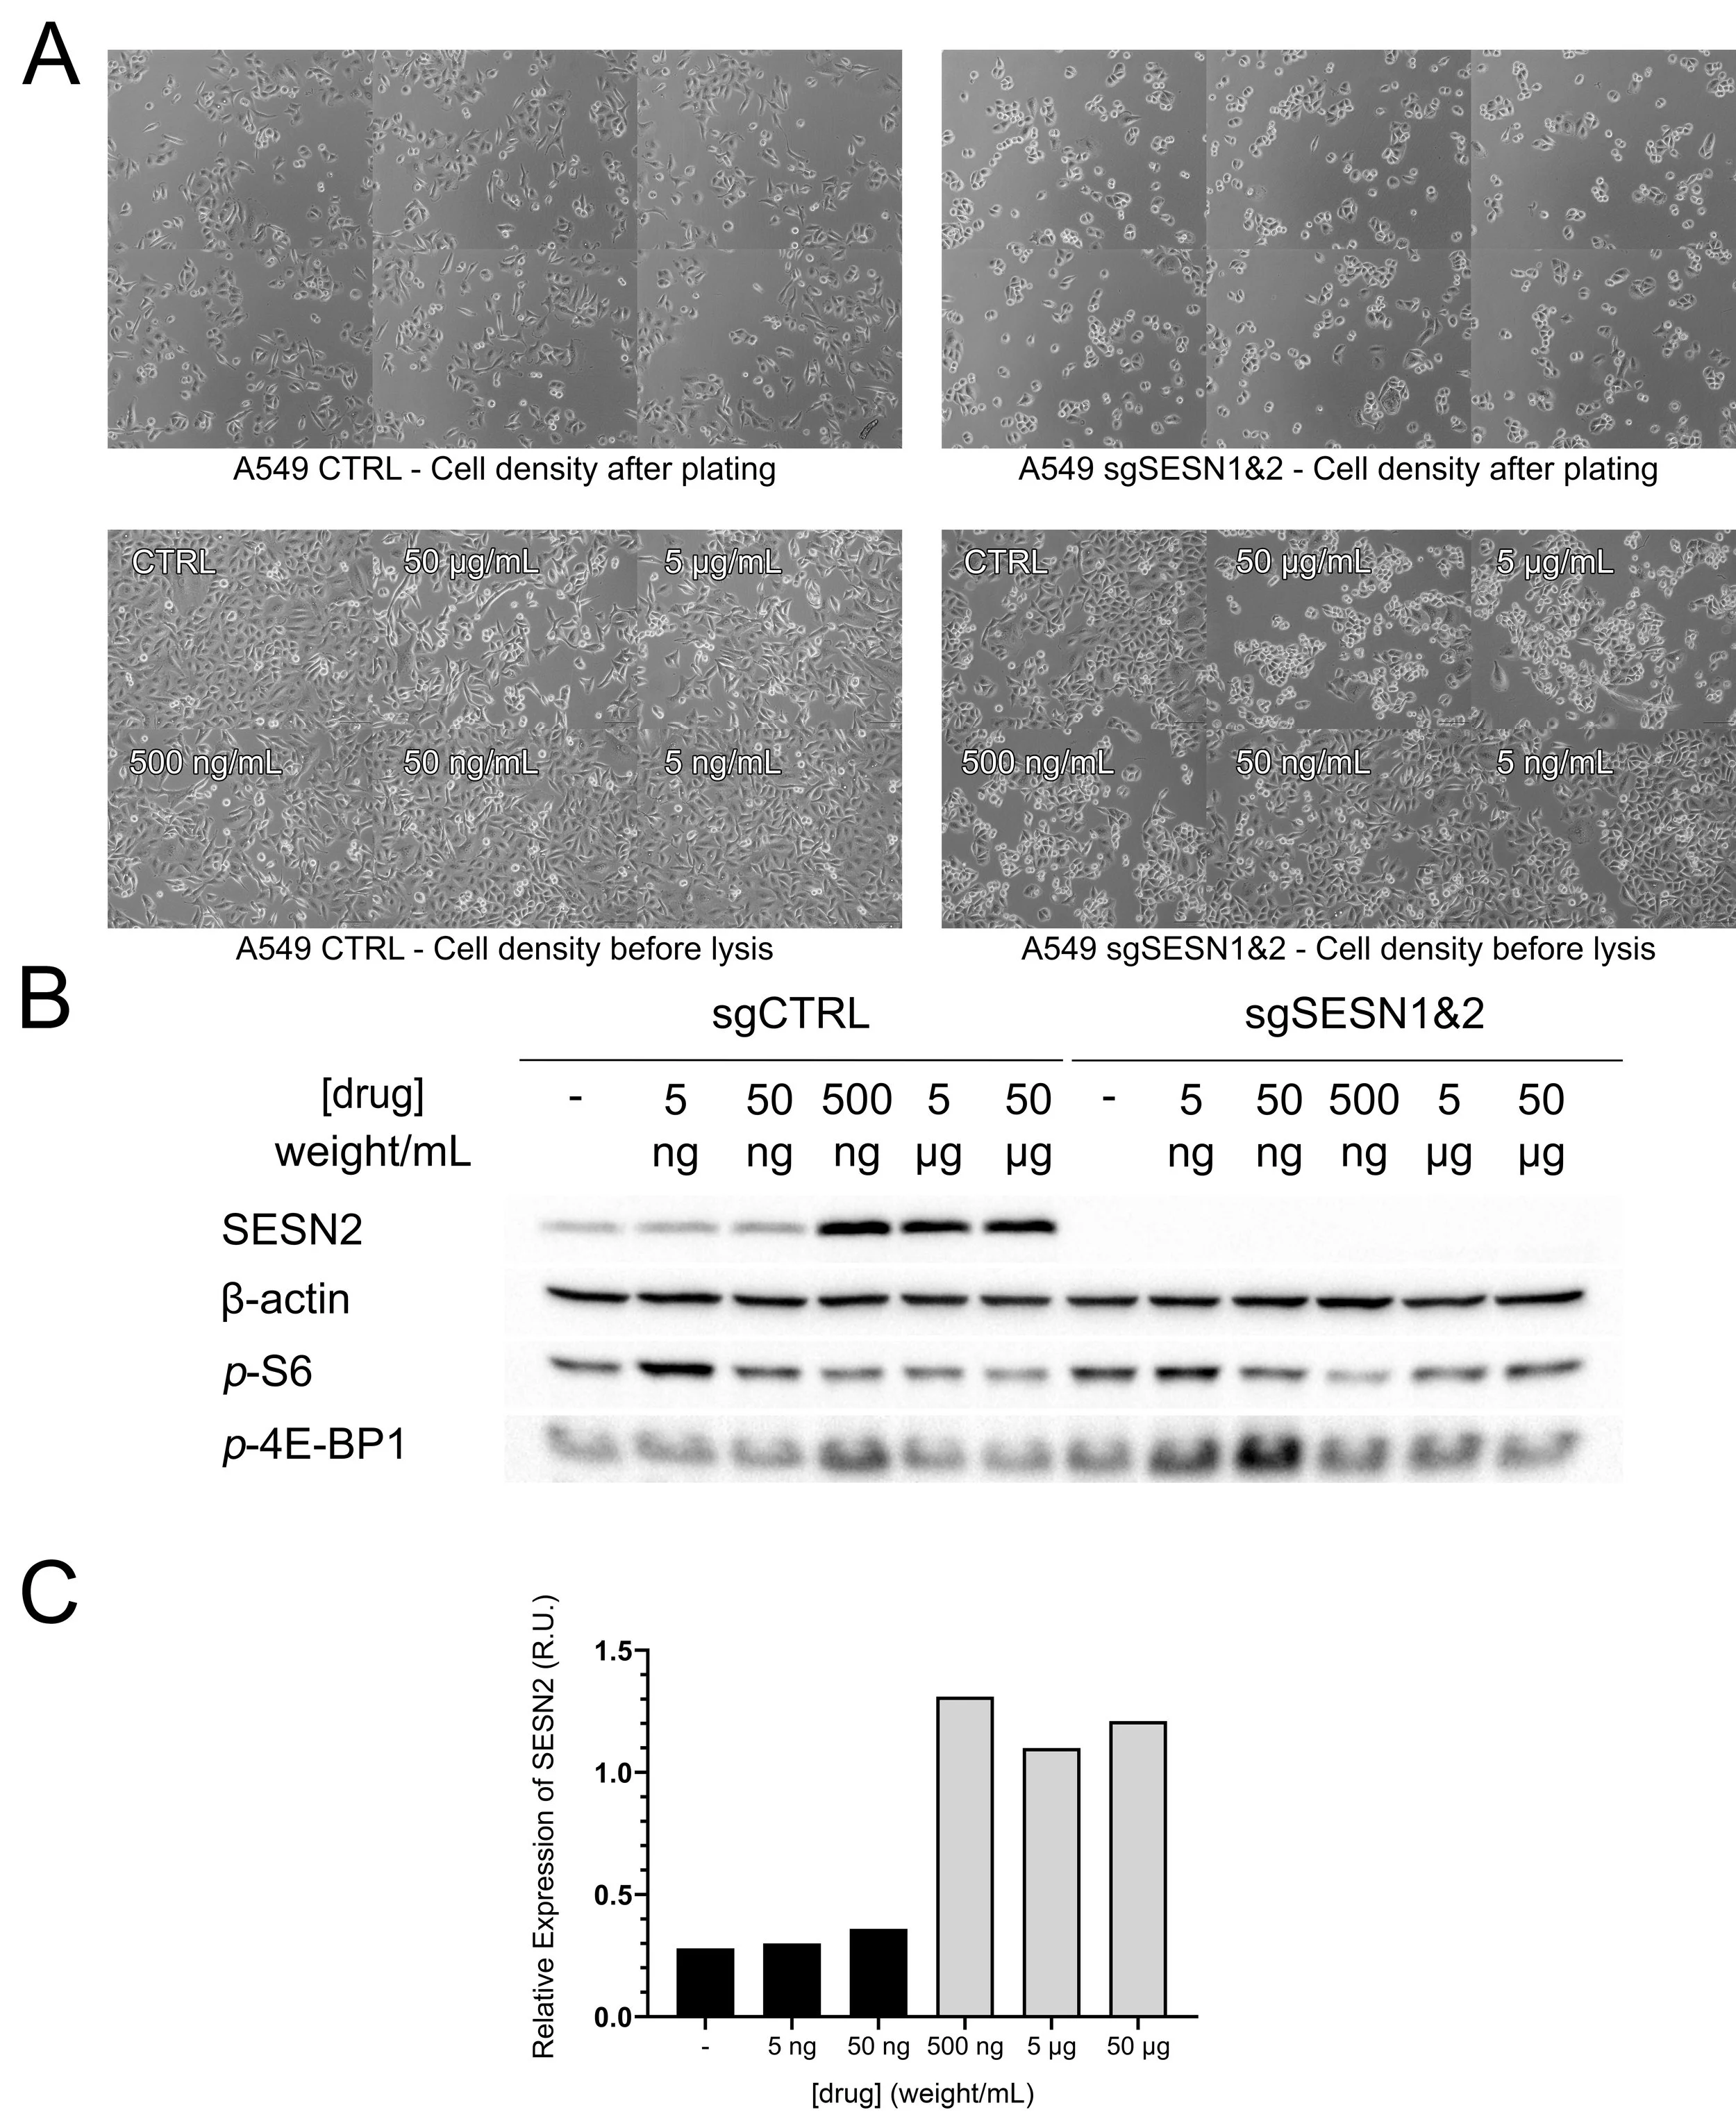
Figure 1. SESN2 is upregulated in response to a 24-hour treatment with the stress-inducing drug. A Images of cells grown in the presence or absence of the drug were captured using the Olympus IX81 microscope. B Western blot was used to detect levels of β-actin (loading control), p-S6, p-4E-BP1 and SESN2, in cells expressing SESN1&2 (sgCTRL) or in cells that are knockouts for SESN1&2 (sgSESN1&2). Blot images were captured using Bio-Rad GelDoc and ImageLab software. C Chart of SESN2 levels in varying concentrations of drug. Quantification was performed using volume tools in Bio-Rad ImageLab and charted using GraphPad Prism 8.
Based on their previous results, the student selected a concentration of 500 ng/mL and performed a time-course experiment, attempting to assess the time required for the optimal SESN2 induction.
The results indicate that SESN2 levels significantly increase after 12 hours of treatment (Figure 2B). Interestingly, SESN2 expression appears to return to baseline by 24 hours. Although this is likely a dud, as the student may have forgotten to add drugs to the following well. Due to time constraints, this was not further investigated. For subsequent experiments, a 12-hour incubation period was used.
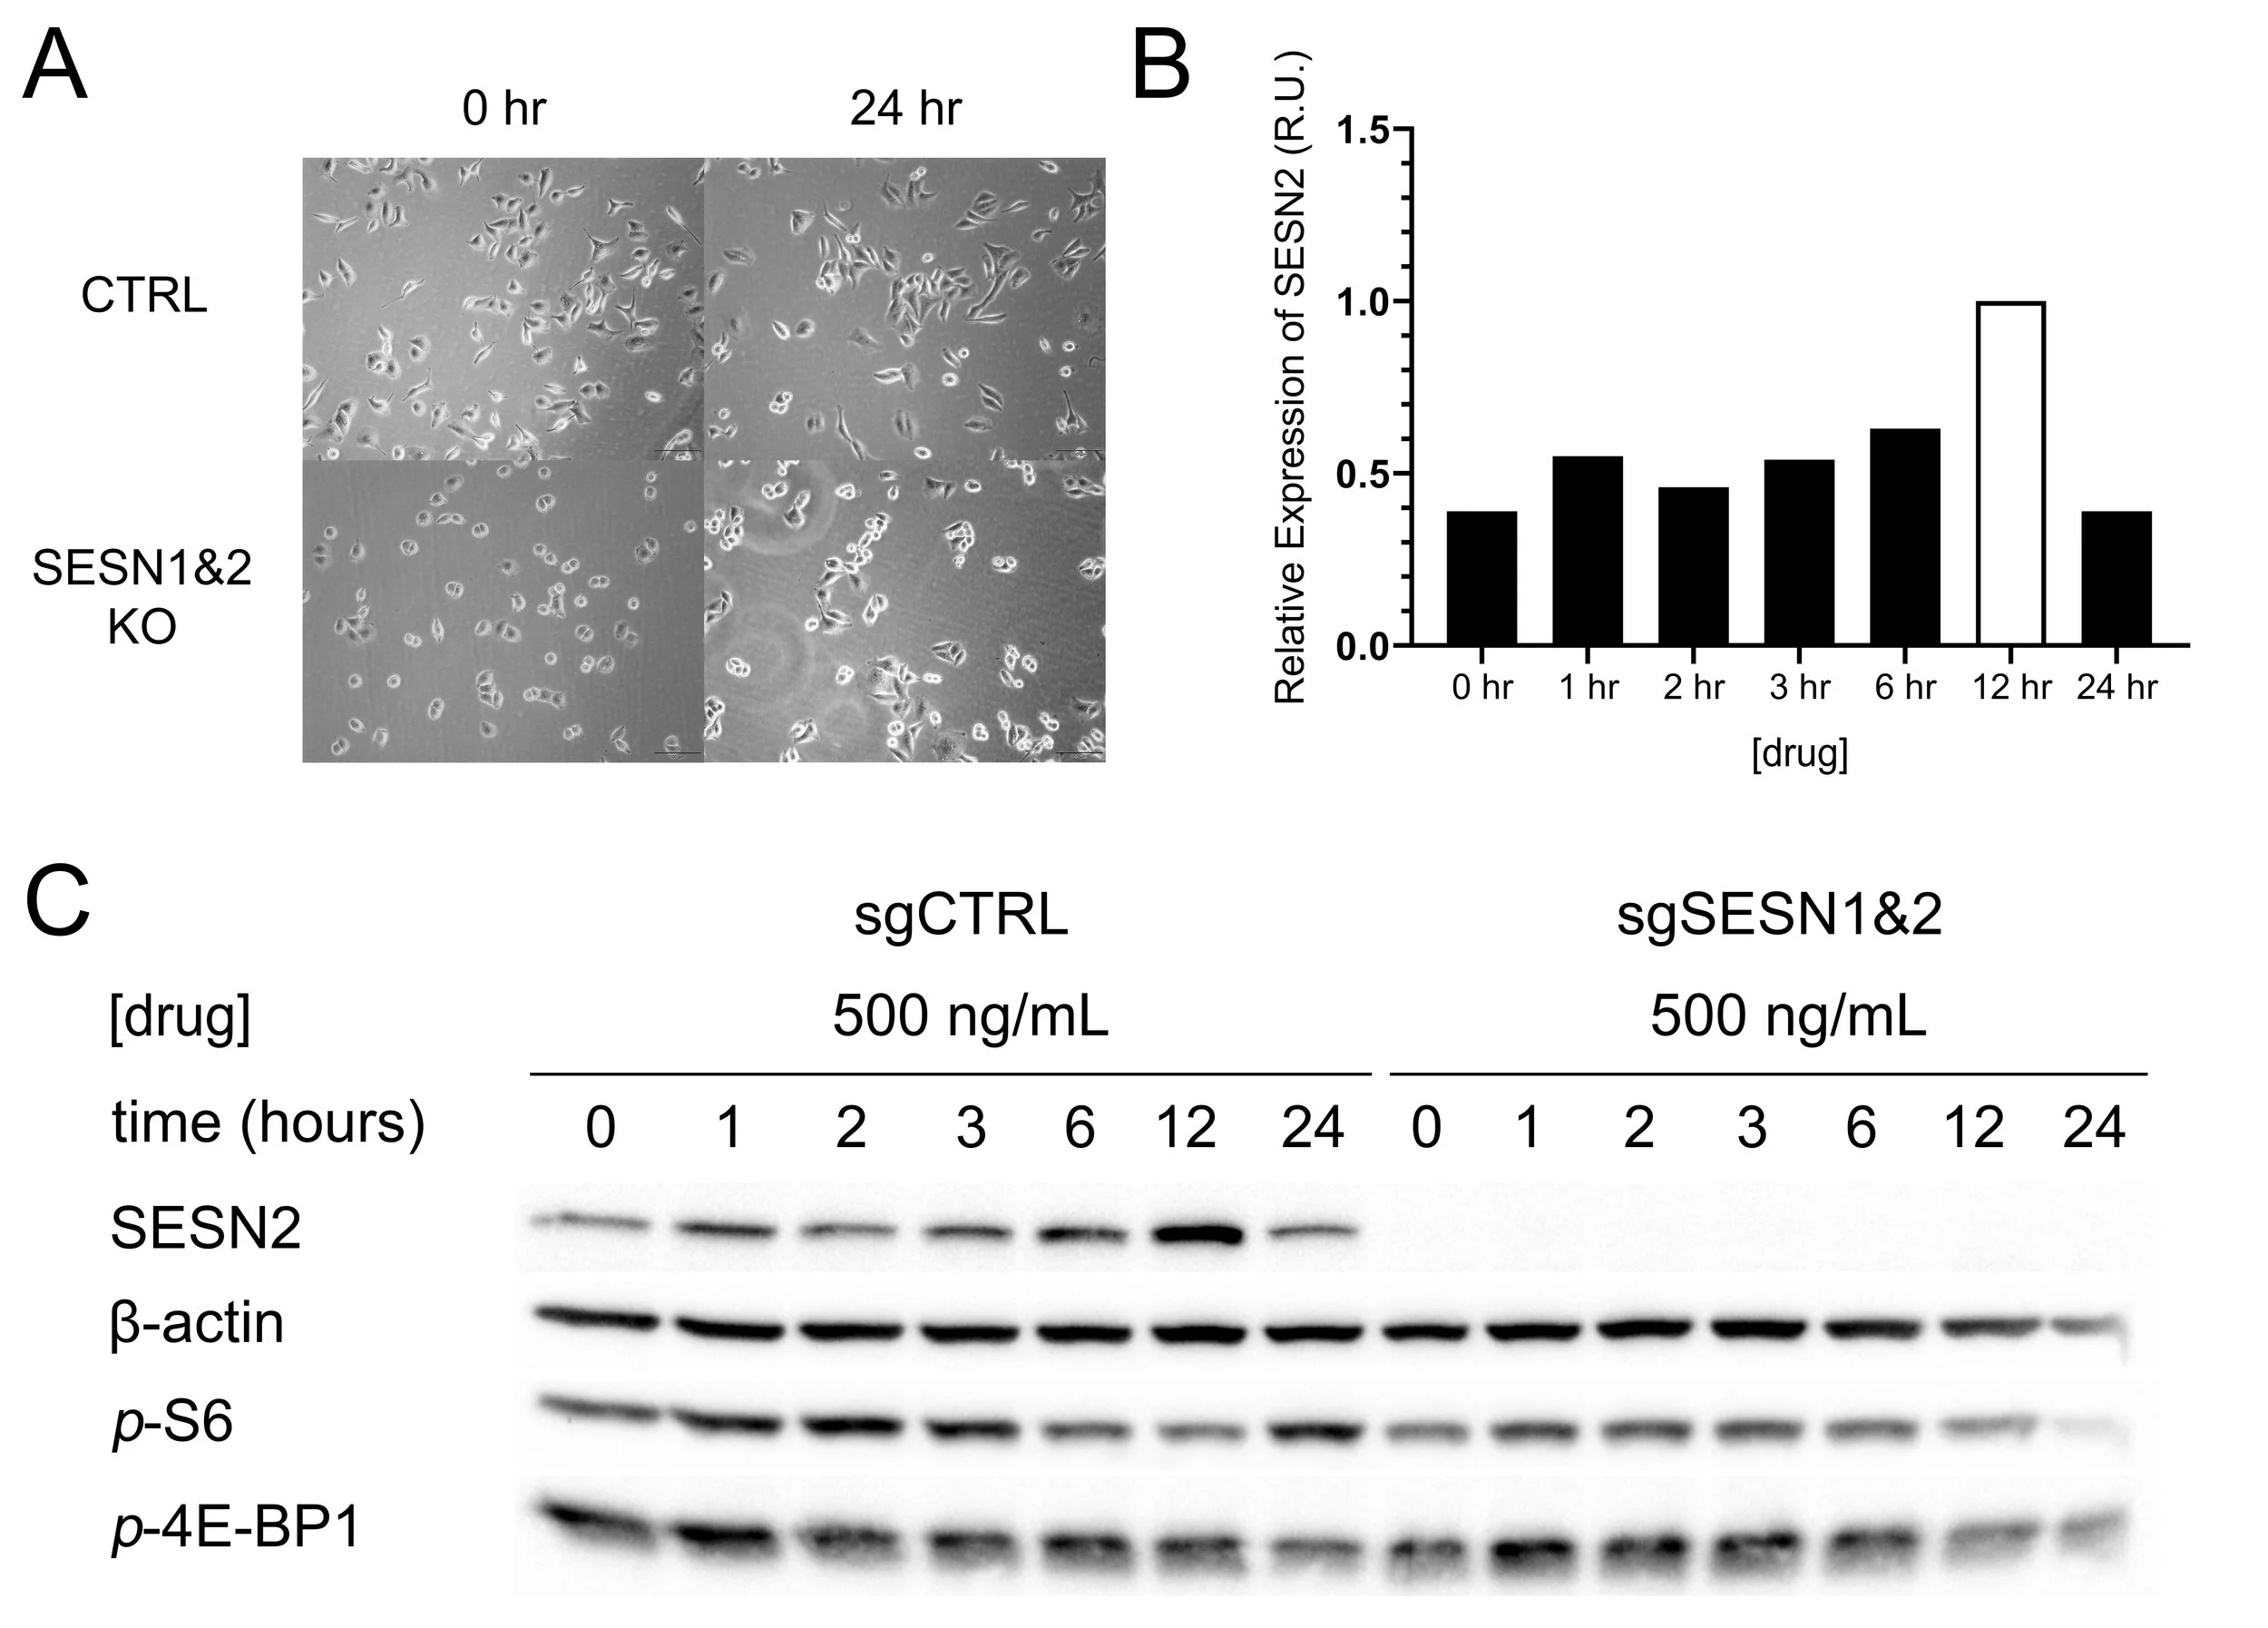
Figure 2. SESN2 is upregulated in response to the stress-inducing drug after 12 hours A Figure shows cell morphology before and after treatment with the drug, as captured by Olympus IX81. B Chart of SESN2 levels assembled using Bio-Rad ImageLab and GraphPad Prism 8. C Western blot used to detect levels of SESN2, p-S6, p-4E-BP1 and β-actin. Images were captured and prepared using Bio-Rad GelDoc, ImageLab software and GraphPad Prism 8.
Finally, the student conducted an expanded experiment using three previously established concentrations of the compound and a fixed 12-hour incubation period. Each condition was performed in triplicate to illustrate the variability and reproducibility of the observed effects.
The results support the hypothesis that SESN2 plays an important role in modulating mTORC1 activity in this type of stress. In the presence of SESN1&2, mTORC1 activity is reduced, as indicated by significantly decreased levels of phospho-S6 and phospho-4E-BP1 (Figure 3D&E — sgCTRL). In contrast, when SESN1&2 are absent, mTORC1 activity remains unaffected or even elevated, as shown by stable phospho-S6 levels and increased phospho-4E-BP1 (Figure 3D&E — sgSESN1&2).
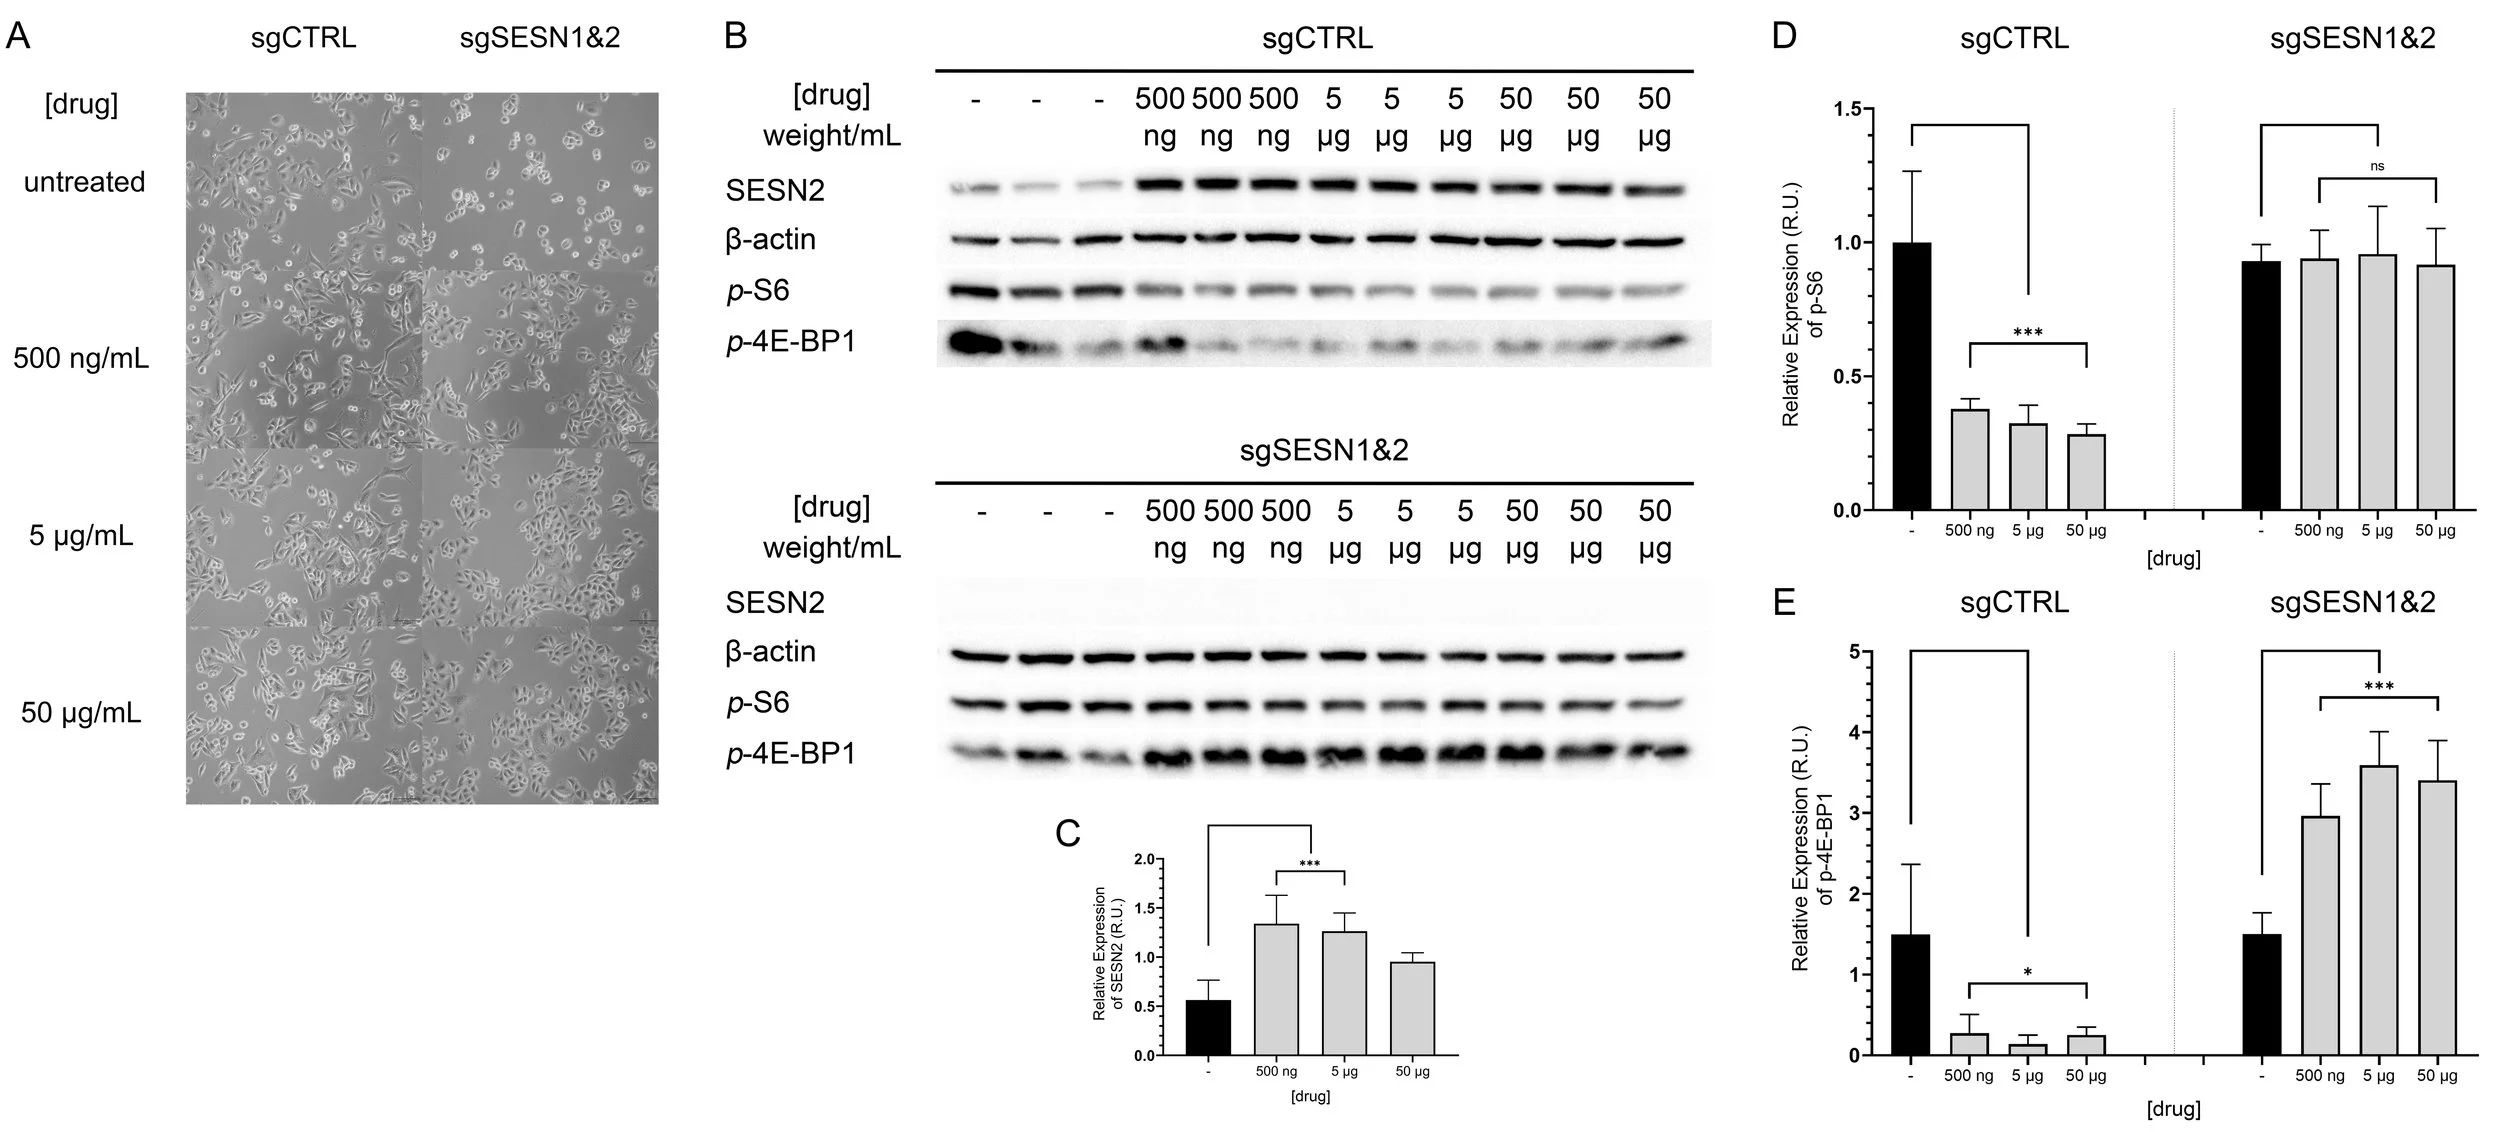
Figure 3. Cellular stress, drug-induced SESN2 activation, and mTOR effects. A Image of cells immediately preceding lysis. B Western blot shows SESN2, β-actin, p-S6 and p-4E-BP1 levels in varying concentrations of the drug. Repeats (n=3) are shown. Images are captured using Bio-Rad GelDoc and ImageLab software. C-D Graphs of SESN2, p-S6 and p-4EBP1 expression levels normalised by β-actin were prepared using ImageLab and GraphPad Prism 8. Statistical analysis was performed using one-way ANOVA followed by Dunnett’s multiple comparisons test (α = 0.05)